Lady tasting tea#
In this page, we analyze the famous experiment of the lady tasting tea.
This is an experiment discussed by Ronald Fisher and
… loosely based on an event in Fisher’s life. The lady in question, Muriel Bristol, claimed to be able to tell whether the tea or the milk was added first to a cup. Her future husband, William Roach, suggested that Fisher give her eight cups, four of each variety, in random order. One could then ask what the probability was for her getting the specific number of cups she identified correct (in fact all eight), but just by chance.
…
The experiment provides a subject with eight randomly ordered cups of tea – four prepared by pouring milk and then tea, four by pouring tea and then milk. The subject attempts to select the four cups prepared by one method or the other, and may compare cups directly against each other as desired.
In fact, Muriel Bristol was able to correctly identify the four cups of tea for which milk had been poured before the tea.
Fisher’s write-up of this experiment and his proposed analysis, was the first time he proposed the idea of the null hypothesis.
As you remember, the null hypothesis — or null model — is a model of the world that is as close as possible to the real world, but having set the effect you are interested in to be 0 (null).
In this case, the null model is that Muriel Bristol was in general unable to distinguish the milk-first tea from the milk-second tea, and was therefore choosing cups at chance.
Let us build something like the data the Fisher had, and see how we can do our test.
import numpy as np
# A numpy random number generator
rng = np.random.default_rng()

import pandas as pd
# Safe setting for Pandas.  Needs Pandas version >= 1.5.
pd.set_option('mode.copy_on_write', True)

# Load the library for plotting, name it 'plt'
import matplotlib.pyplot as plt
# Make plots look a little more fancy
plt.style.use('fivethirtyeight')
We’ll build a data table similar to the one that Fisher would have been looking at when he did his analysis.
Show code cell content
# Just run the code in this cell.
# Make an empty DataFrame to store the eight cups.
tea_df = pd.DataFrame()
# insert a column that records whether Fisher had in fact poured the milk
# before the tea, into that cup:
tea_df['milk_first'] = np.repeat(['yes', 'no'], [4, 4])
# Add a column recording which cups Muriel chose as her guesses for the
# cups where Fisher had poured the milk first:
tea_df['says_milk_first'] = np.repeat(['yes', 'no'], [4, 4])
# Take a sample (without replacement) of 8 rows.
# This has the effect of putting rows in random order.
tea_df = tea_df.sample(8, replace=False)
# Reset the row labels to throw away the labels showing the original order.
tea_df = tea_df.reset_index(drop=True)
# Show our reconstruction of Fisher's table
tea_df
| milk_first | says_milk_first | |
|---|---|---|
| 0 | no | no |
| 1 | no | no |
| 2 | no | no |
| 3 | yes | yes |
| 4 | no | no |
| 5 | yes | yes |
| 6 | yes | yes |
| 7 | yes | yes |
Now we have something like the experimental data — the actual situation
(milk_first) and Muriel’s identification says_milk_first.
We fetch the two columns back out of the data frame as two Series:
milk_first = tea_df['milk_first']
says_milk_first = tea_df['says_milk_first']
says_milk_first
0     no
1     no
2     no
3    yes
4     no
5    yes
6    yes
7    yes
Name: says_milk_first, dtype: object
It is often useful to cross-tabulate the rows of the data frame by giving counts in each category. pd.crosstab does this job, given the two columns of data.
counts_tab = pd.crosstab(milk_first, says_milk_first)
counts_tab
| says_milk_first | no | yes |
|---|---|---|
| milk_first | ||
| no | 4 | 0 |
| yes | 0 | 4 |
Notice that the cross-tabulation counts the number of rows (observations) in each of the four possible categories:
Actually milk-first, Muriel says milk-first (‘yes’, ‘yes’ rows).
Actually milk-second, Muriel says milk-first (‘no’, ‘yes’ rows).
Actually milk-first, Muriel says milk-second (‘yes’, ‘no’ rows).
Actually milk-second, Muriel says milk-second (‘no’, ‘no’, rows).
We will concentrate on the ‘yes’, ‘yes’ combination. If Muriel correctly identifies all four of the milk-first cups, that means she got every cup correct — because she must identify four as milk-first, and four as tea-first.
In other words, if she got all milk-first cups right (‘yes’, ‘yes’), then she necessarily got all four tea-first cups right (‘no’, ‘no’).
milk_first_correct = counts_tab.loc['yes', 'yes']
milk_first_correct
4
As we know, in fact, Muriel guessed correctly for each of the eight cups, and so correctly identified all four milk-first cups.
Now our question is — how would we decide if this could reasonably have come about by chance? This is the question we answer with inference.
Inference#
Remember the steps in inference.
Find the data. In our case, these are the data in
tea_dfDataFrame.Calculate some measure of interest from the data. Call this the observed statistic. Let us use the number of milk-first cups that Muriel identified:
milk_first_correctabove.Make a simple null-model of the world to offer as an explanation of the data. In our null-world, Muriel has no ability to distinguish milk-first from milk-second cups, and is therefore guessing when choosing her four cups.
Simulate the data many times using the simple (null-world) model.
For each simulation calculate the measure of interest. Call these the simulated measures. Our simulated measures were the number of black jurors in each simulation.
Use the simulated measures to build up the sampling distribution.
Compare the observed measure to the sampling distribution, to see whether it represents a rare or common event, given the model.
Our remaining work is to build the null-world model, in which we do the simulations.
The experiment requires that Muriel chose four cups. So we always have four ‘yes’ votes and four ‘no’ votes.
How can we simulate our null-world, where Muriel is distributing her four ‘yes’ and four ‘no’ replies randomly across the cups?
If those votes are random, that is the same thing as saying that Muriel’s votes could be in any random order.
This gives us an idea for a single trial of eight cups in the null world. First we shuffle Muriel’s replies into a random order:
# Make the random association.
fake_says = rng.permutation(says_milk_first)
fake_says
array(['yes', 'yes', 'no', 'no', 'yes', 'yes', 'no', 'no'], dtype=object)
Then we rebuild the counts table but with the random ordering of replies.
# Table with the random ordering of replies.
fake_counts_tab = pd.crosstab(milk_first, fake_says)
fake_counts_tab
| col_0 | no | yes |
|---|---|---|
| milk_first | ||
| no | 1 | 3 |
| yes | 3 | 1 |
Then we look at the count we got for ‘yes’, ‘yes’ with this fake ordering.
fake_mf_correct = fake_counts_tab.loc['yes', 'yes']
fake_mf_correct
1
Now we know how to do one trial, we can extend to thousands of trials:
# Notice we're only using 1000 iterations, not our usual 10_000
# This is to save some time; the crosstab is a little slow.
n_iters = 1000
fake_mf_corrects = np.zeros(n_iters)
for i in np.arange(n_iters):
    fake_says = rng.permutation(says_milk_first)
    fake_counts_tab = pd.crosstab(milk_first, fake_says)
    fake_mf_correct = fake_counts_tab.loc['yes', 'yes']
    fake_mf_corrects[i] = fake_mf_correct
fake_mf_corrects[:10]
array([3., 2., 2., 3., 1., 1., 2., 2., 2., 3.])
Each value in the 1000 fake_mf_corrects array is a ‘yes’, ‘yes’ count that
we saw in a particular trial in the null world, where Muriel was choosing the
four cups at random.
plt.hist(fake_mf_corrects, bins=np.arange(5));
plt.title('Sampling distribution of yes, yes counts');
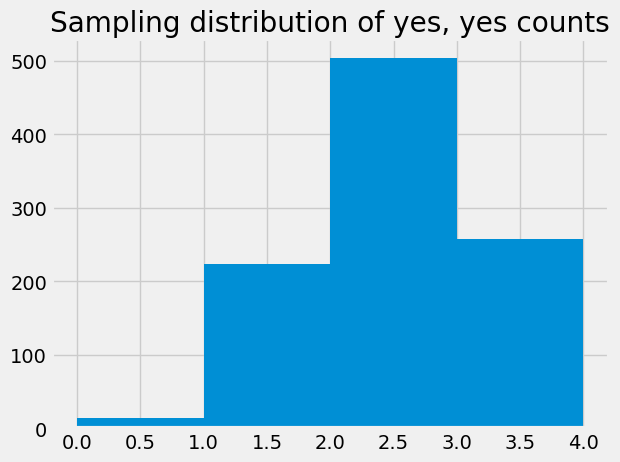
The result in the real world was that Muriel identified all four milk-first (‘yes’) cups, and therefore, chose correctly in all 8 cases. How likely is that result, in our null world (null model)?
np.count_nonzero(fake_mf_corrects == 4) / n_iters
0.017
The result in the real world was surprising, if the null model was correct. We may therefore choose to provisionally reject the null model, and suspect that there was some deviation from the null model — for example, that Muriel was in fact able to do better than chance in detecting the milk-first cups.
Fisher’s exact test#
In fact, Fisher used an almost identical method to solve the problem in his original description.
His method differs only in that, instead of trying lots of different random permutations of the pairings, he used a mathematical method to work out:
how many possible permutations there are, and
how many of these possible permutations give a value as great or greater than the value we observe.
In this case, that problem is fairly easy to solve, because there is only one way that we can end up with 4 out of 4 ‘yes’, ‘yes’ answers (all correct).
To start, there are 4 cups. Muriel has a 4/8 chance of selecting the correct cup.
Next time round, there are seven cups, three with milk-first; she has a 3 / 7 chance.
For her four choices then, we have the following four chances, applied one after the other.
# Probability that Muriel will select all 4 milk-first cups
# correctly if she is just guessing.
4 / 8 * 3 / 7 * 2 / 6 * 1 / 5
0.014285714285714285
This turns out to be one chance in 70. There are 70 possible unique
permutations of the milk-first yes, no and Muriel’s guesses, of which only
one gives all 4 yes, yes correct.
no, no).
1 / 70
0.014285714285714285
We can generalize this technique of counting all possible permutations, and dividing into the number of permutations giving a value equal or greater than the one we observe. The method is called Fisher’s Exact test, after Fisher’s first description, with the Lady Tasting Tea problem.
# Get stats module from Scipy.
import scipy.stats as sps
# Calculate Fisher's Exact Test p-value
odds_ratio, p_value = sps.fisher_exact(counts_tab,
                                       alternative='greater')
p_value
0.014285714285714284
As you can see, Fisher’s Exact Test gives a very similar p-value to the one we got from random permutations, and exactly the 1 / 70 value we worked out above.
One-tailed and two-tailed alternatives#
Notice the alternative='greater' argument to the function. This tells the
routine to look for all permutations that give top-left value that is
greater than, or equal to, the top-left value of the counts_tab we passed.
Note - the top-left value is the count for no and no, and we were actually interested in the bottom-right value (yes, yes), but because of the way that 2 by 2 tables work, this is the same as doing the test on the top-left value. Put another way, the routine tests the no, no value, but if Muriel gets all the yes cups right (yes, yes), she must also get all the no cups right (no, no).
In our case, we do want to do the alternative='greater' test, because we are only interested in whether Muriel can do better than chance - not whether she can do worse than chance.
Put another way, our alternative to the null-hypothesis, is that Muriel can do better than chance.
But you could imagine other situations where you are looking more generally for signs that the table shows some deviation from chance, and in that case, you might also consider the situation where Muriel systematically said no to the yes cups, and yes to the no cups. In that case, you would be interested in either of a very high value for no, no (4 - the actual result), or a very low value for no, no (0 - the result if Muriel was getting it systematically and invariably wrong).
If we are prepared to consider either a low value or a high value as evidence against the null-hypothesis, then our altnerative hypothesis is that Muriel is either doing better than chance or worse than chance. We will accept evidence for either of these cases as evidence against the null-hypothesis, of Muriel guessing at random.
In that case, we call this a two-tailed alternative. In contrast, our original test was one-tailed because we were only considering the high value (the high tail) as interesting.
If you allow both high and low values to be interesting, then there are two interesting permutations of the 70 unique permutations, the no, no = 4 permutation and the no, no = 0 permutation, and the probability value of seeing either of these permutations, for any given random permutation, is twice as large:
2 / 70
0.02857142857142857
# Two-tailed alternative, p-value.
t2_odds_ratio, t2_p_value = sps.fisher_exact(counts_tab,
                                            alternative='two-sided')
t2_p_value
0.028571428571428567