Pandas and dictionaries#
Dictionaries are everywhere in Pandas, if you but look a little deeper.
Consider — where would it be useful to have something that associates a name (a key) with a value or sequence of values?
And in fact - the idea of names mapping to values is fundamental to Pandas.
import numpy as np
import pandas as pd

pd.set_option('mode.copy_on_write', True)

import matplotlib.pyplot as plt
Building data frames with arrays and lists#
Let us say you found yourself in the situation where you had a list of some English Premier League (EPL) teams outside London. Maybe you have typed this in. In any case, here it is:
teams = [
    'Wolverhampton Wanderers',
    'Brighton and Hove Albion',
    'Newcastle',
    'Bournemouth',
    'Nottingham Forest',
    'Aston Villa',
    'Everton'
]
You also have the corresponding wage bills, from the 2022-2023 EPL wages
wages = [
    64_055_000,
    15_679_600,
    77_503_600,
    43_836_000,
    75_260_000,
    86_060_000,
    80_707_000
]
And actually, you have the corresponding number of points at the end of the season, for each team, recorded from the EPL league table:
points = [
    41,
    62,
    71,
    39,
    38,
    61,
    36,
]
We’d really like a data frame with these columns: ‘Team’, ‘Wages’, and ‘Points’.
Luckily our task is all but done for us, once we have made the dict (mapping) between the names and the values.
ready_for_df = {
    'Team': teams,
    'Wages': wages,
    'Points': points
}
ready_for_df
{'Team': ['Wolverhampton Wanderers',
  'Brighton and Hove Albion',
  'Newcastle',
  'Bournemouth',
  'Nottingham Forest',
  'Aston Villa',
  'Everton'],
 'Wages': [64055000,
  15679600,
  77503600,
  43836000,
  75260000,
  86060000,
  80707000],
 'Points': [41, 62, 71, 39, 38, 61, 36]}
Enter pd.DataFrame. As usual, investigate with shift-tab in the function name in Jupyter, but one good way of using that function is to pass a dictionary that names the columns, like this:
epl = pd.DataFrame(ready_for_df)
epl
| Team | Wages | Points | |
|---|---|---|---|
| 0 | Wolverhampton Wanderers | 64055000 | 41 |
| 1 | Brighton and Hove Albion | 15679600 | 62 |
| 2 | Newcastle | 77503600 | 71 |
| 3 | Bournemouth | 43836000 | 39 |
| 4 | Nottingham Forest | 75260000 | 38 |
| 5 | Aston Villa | 86060000 | 61 |
| 6 | Everton | 80707000 | 36 |
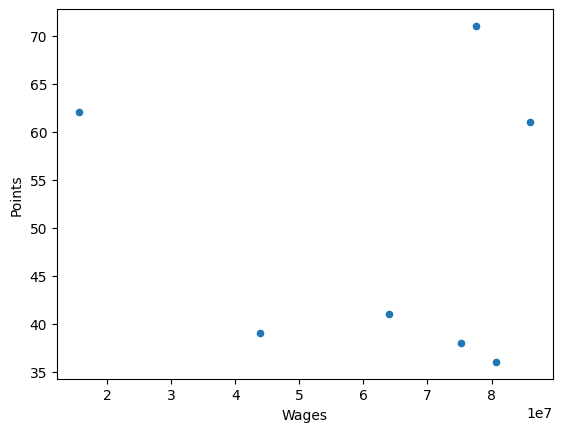
We can’t help it, let’s have a look at the wages vs points for this very small sample.
Remember the plot methods of the data frame. These give us some nice features, including automatic labels.
epl.plot.scatter(x='Wages', y='Points')
<Axes: xlabel='Wages', ylabel='Points'>
What is another mapping we might want?
Well - what if we don’t like the column names of our current data frame? We want to map from the current column name, to the new column name. The mapping might look like this:
renames = {'Team': 'Team name',
           'Wages': 'Estimated wages for year in £'}
renames
{'Team': 'Team name', 'Wages': 'Estimated wages for year in £'}
We can use the rename method of the data frame to apply this mapping:
fancier_epl = epl.rename(columns=renames)
fancier_epl
| Team name | Estimated wages for year in £ | Points | |
|---|---|---|---|
| 0 | Wolverhampton Wanderers | 64055000 | 41 |
| 1 | Brighton and Hove Albion | 15679600 | 62 |
| 2 | Newcastle | 77503600 | 71 |
| 3 | Bournemouth | 43836000 | 39 |
| 4 | Nottingham Forest | 75260000 | 38 |
| 5 | Aston Villa | 86060000 | 61 |
| 6 | Everton | 80707000 | 36 |
Notice we have just renamed the columns in the mapping.
Let’s construct a dictionary from scratch with the team names and the wages:
team_wages = {}
for i in range(len(teams)):
    team_wages[teams[i]] = wages[i]
team_wages
{'Wolverhampton Wanderers': 64055000,
 'Brighton and Hove Albion': 15679600,
 'Newcastle': 77503600,
 'Bournemouth': 43836000,
 'Nottingham Forest': 75260000,
 'Aston Villa': 86060000,
 'Everton': 80707000}
Remember that a dict has a default sequence that it gives you, if asked, and that is the keys:
# We ask for a sequence from the keys
list(team_wages.keys())
['Wolverhampton Wanderers',
 'Brighton and Hove Albion',
 'Newcastle',
 'Bournemouth',
 'Nottingham Forest',
 'Aston Villa',
 'Everton']
The default sequence is the keys:
list(team_wages)
['Wolverhampton Wanderers',
 'Brighton and Hove Albion',
 'Newcastle',
 'Bournemouth',
 'Nottingham Forest',
 'Aston Villa',
 'Everton']
Pandas data frames also have a default sequence that it gives if asked, and these are the column names:
list(fancier_epl)
['Team name', 'Estimated wages for year in £', 'Points']
Can you think of another mapping in Pandas? How about the labels for the rows?
# Map from the label 3 to the row with that label
fancier_epl.loc[3]
Team name                        Bournemouth
Estimated wages for year in £       43836000
Points                                    39
Name: 3, dtype: object
We can make that more obvious by putting text labels on the data frame:
labeled_epl = fancier_epl.set_index('Team name')
labeled_epl
| Estimated wages for year in £ | Points | |
|---|---|---|
| Team name | ||
| Wolverhampton Wanderers | 64055000 | 41 |
| Brighton and Hove Albion | 15679600 | 62 |
| Newcastle | 77503600 | 71 |
| Bournemouth | 43836000 | 39 |
| Nottingham Forest | 75260000 | 38 |
| Aston Villa | 86060000 | 61 |
| Everton | 80707000 | 36 |
# Map from label Bournemouth to the matching row.
labeled_epl.loc['Bournemouth']
Estimated wages for year in £    43836000
Points                                 39
Name: Bournemouth, dtype: int64
The mapping is particularly obvious when we have a Series:
wage_series = labeled_epl['Estimated wages for year in £']
wage_series
Team name
Wolverhampton Wanderers     64055000
Brighton and Hove Albion    15679600
Newcastle                   77503600
Bournemouth                 43836000
Nottingham Forest           75260000
Aston Villa                 86060000
Everton                     80707000
Name: Estimated wages for year in £, dtype: int64
The series is very dict-ey, because the labels map to values. In fact, it is so dict-ey, that the series has a to_dict method to give you the equivalent dict:
wages_as_dict = wage_series.to_dict()
wages_as_dict
{'Wolverhampton Wanderers': 64055000,
 'Brighton and Hove Albion': 15679600,
 'Newcastle': 77503600,
 'Bournemouth': 43836000,
 'Nottingham Forest': 75260000,
 'Aston Villa': 86060000,
 'Everton': 80707000}
You can map straight back to a series with the pd.Series constructor:
pd.Series(wages_as_dict)
Wolverhampton Wanderers     64055000
Brighton and Hove Albion    15679600
Newcastle                   77503600
Bournemouth                 43836000
Nottingham Forest           75260000
Aston Villa                 86060000
Everton                     80707000
dtype: int64